UCLA Fielding School researchers find California's Latinos suffer high mortality rates
David Hayes-Bautista & Paul Hsu found that Latino Californians suffer significantly higher COVID-19 pandemic-related deaths than non-Hispanic whites.

UCLA researchers have found that during its first year, the coronavirus has ravaged Latino families and communities in California and other states far more seriously than it has non-Latino populations, with a consequent impact on the U.S. economy.
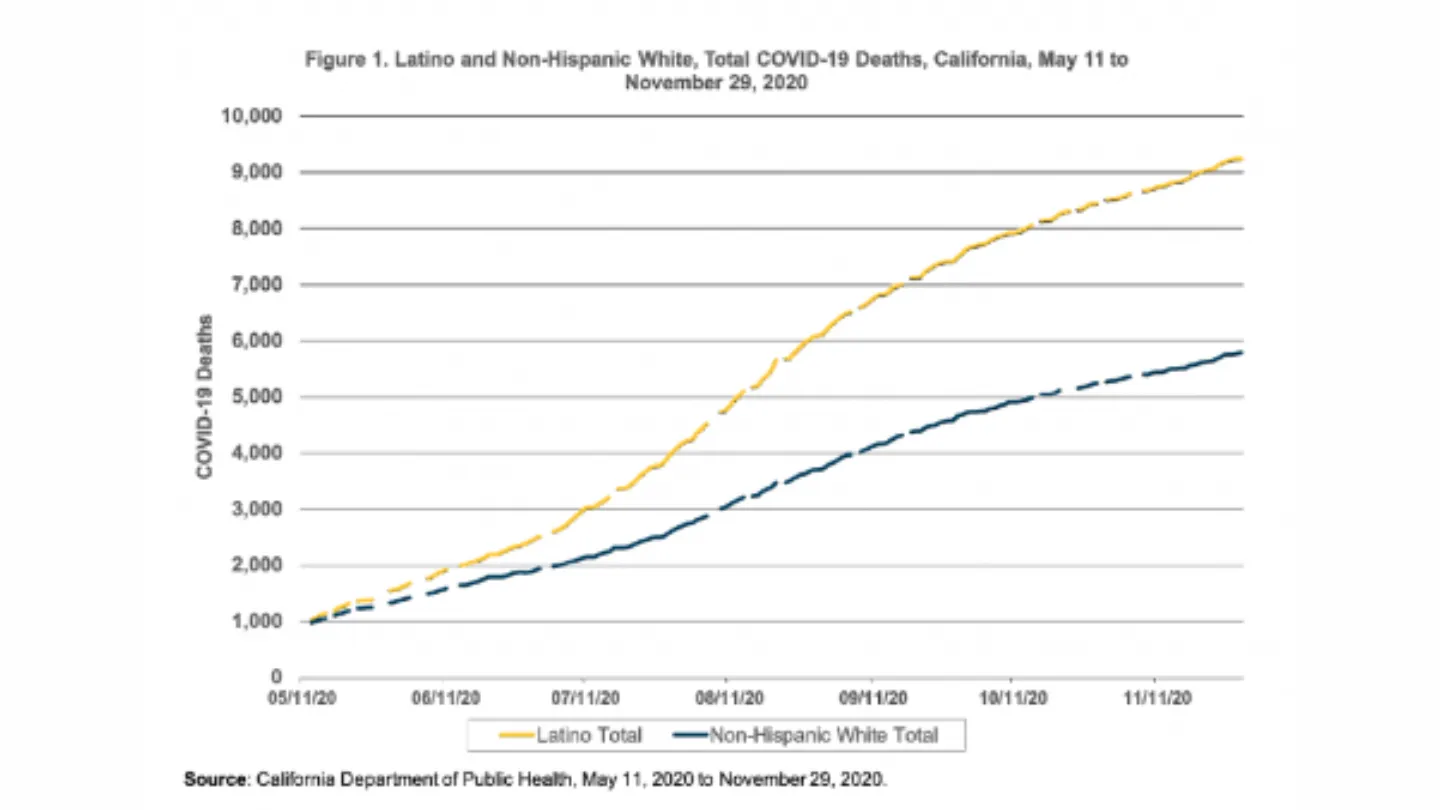
Latinos make up 39.3% of California’s population (15.5 million people), yet they constitute a far larger percentage (48.5%) of all COVID-19‒related deaths in the state. In contrast, non-Hispanic whites make up 36.6% of California’s population (14.5 million people), but have accounted for only 30.4% of all the state’s COVID-19 deaths.

Latino and non-Hispanic white COVID-19-related mortality in California.
“Farm workers, meatpacking workers, grocery store clerks, and nursing home attendants are also essential workers,” said Paul Hsu, UCLA Fielding School of Public Health assistant professor of epidemiology, who co-wrote the report "The First Year of Latino COVID-19 Deaths: Why Should Anyone Care?" “But as they worked shoulder to shoulder in the fields or checked out customers’ shopping carts, they were not provided personal protective gear until late in the pandemic. With more exposure to the coronavirus, coupled with less access to care, Latino essential workers have had higher case rates, and now have higher death rates.”
The authors note that by 2018, the 60 million Latinos living in the U.S. had created the equivalent of the world’s eighth-largest GDP: $2.6 trillion in size, larger than the GDPs of Italy, Brazil, South Korea, or Russia. The U.S. Latino GDP ranks comfortably in the top ten GDPs of the world.
This U.S. Latino GDP has been growing impressively for nearly a decade. From 2010 to 2018, the U.S. Latino GDP had an annual growth rate of 3.3%, while the non-Latino portion of the U.S. GDP had a weaker growth rate, at 2.1%
“It comes as a surprise to many that the 60 million Latinos in the U.S. have created the eighth-largest economy in the world,” said David E. Hayes-Bautista, UCLA Fielding School of Public Health professor of health policy and management and professor of medicine at the UCLA David Geffen School of Medicine. “What is more surprising is that the U.S. Latino GDP has been growing nearly 60% faster than the overall U.S. GDP since 2010. The U.S. Latino GDP is the brightest spot in the nation’s economy.”
Hard work, strong families, self-sufficiency, business friendliness, healthy behaviors, patriotism: these values drove Latino adults during the 1990s and early 2000s to lay the foundations of what became the world’s eighth-largest economy by 2018, Hayes-Bautista said.
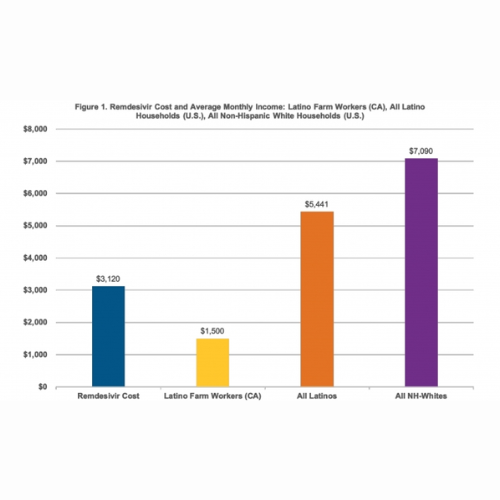
“The strong Latino work ethic is seen in the fact that Latino households have more wage- earners than non-Hispanic white households,” he said. ”However, when they have to work more exposed to the coronavirus than white-collar workers, when they are paid very little for their hard work, when they are less likely to be offered health insurance, when they are less likely to find a doctor who can speak Spanish, it is no wonder that working-age Latinos have higher case rates and death rates than the general population.”
When the U.S. economy is growing rapidly, nearly everyone benefits. But when the economic growth rate is anemic—or even worse, negative—nearly everyone suffers. The U.S. Latino GDP is currently the most productive sector for a strong overall U.S. GDP growth. Because COVID-19 is disproportionately killing Latino workers in their most productive years, everyone should care about COVID-19’s effects on the Latino population.
“The U.S. Latino GDP has the potential to power the nation’s economy out of the pandemic. But every working-age Latino who dies due to COVID-19 is one less contributor to the country’s economic future,” Hayes-Bautista said.
Methods:
Data on COVID-19 deaths, stratified by race/ethnicity and by age group, were furnished by the California Department of Public Health (CDPH). As of November 29, 2020, out of 19,220 total deaths, 173 (1%) were missing racial/ethnic information and therefore were excluded from this analysis. Population denominators to calculate the rate of cases per 100,000 were tabulated from the 2018 American Community Survey (ACS).

