New California Health Interview Survey findings show continued fatigue with following safety guidelines
Latest findings from California Health Interview Survey conducted by UCLA CHPR show continued fatigue with following safety guidelines.
With more than 4.8 million cases and over 70,000 deaths due to COVID-19 in California, the UCLA Center for Health Policy Research (CHPR), led by Dr. Ninez Ponce, UCLA Fielding School of Public Health professor of health policy and management, is continuing to track whether residents engaged in risk reduction behaviors such as wearing face coverings or maintaining physical distancing, impacts on personal and financial well-being, and their views on the vaccine.
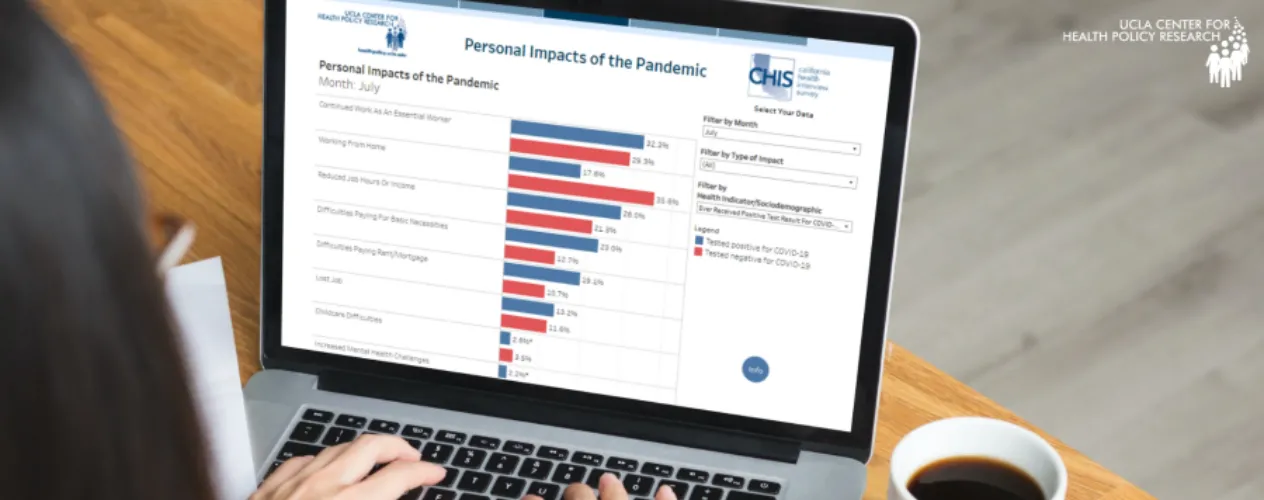
The latest update to the 2021 CHIS COVID-19 Preliminary Estimates Dashboard, which adds responses from 3,932 Californians in July 2021, builds on previously released data collected from March through June of this year. The most recent data show declines in following safety guidelines, including an increase in gathering with members outside of the household, during a month when cases had spiked again. It also showed that Californians who tested positive for COVID-19 were more likely to experience difficulties paying for basic necessities and rent or mortgage than residents who tested negative. Being able to filter impacts by respondents “ever testing positive for COVID-19” was an added feature in the latest dashboard update.
“Given the unpredictable course of case and death rates that are rising and falling in different areas, there is a real need to keep tracking pandemic impacts and related changes in behaviors in California,” said Todd Hughes, CHIS director. “For example, as public health practitioners continue to urge following safety guidelines and getting the vaccine, it’s important to examine whether Californians are still engaging in practices that would mitigate the spread and continue the state’s fight against the pandemic.”
Key findings from the July 2021 data include:
Risk Reduction Behaviors
California adults who said they always wore face coverings when leaving their homes decreased by more than 40% between March and July 2021.
- Among all California adults, 50.2% said they always wore face coverings when leaving their homes in the past week in July 2021, compared to 67.8% in June 2021, 79.1% in May 2021, and 84.8% in March/April 2021.
- By race and ethnicity: White adults were the least likely to always wear face coverings at 27.1%, compared to 72.2% of Black or African American adults, 68.4% of Asian adults, and 63.8% of Latinx adults.
- By vaccine acceptance: Adults who indicated they will not receive the COVID-19 vaccine were the least likely to always wear face coverings at 36.7%, compared to 49.5% of adults who had received at least one dose of the vaccine and 66.4% of adults who had not received the COVID-19 vaccine, but would get it. Nearly 1 in 5, or 18.2% of, adults who said they will not receive the COVID-19 vaccine indicated they never wore face coverings when leaving their home in July, compared to 6.4% in June.
California adults who always maintained 6 feet distance from others when leaving their home in the past week dropped from 54% in March/April to 36.2% in July 2021.
- More than half of Black or African American adults said they always maintained six feet distance from others when leaving their homes compared to 1 in 5 white adults. Asian (41.6%), Latinx (48%), and Black or African American (52.4%) adults were more than twice as likely as white (20.7%) adults to always maintain six feet distance from others when leaving their homes.
69.9% of all California adults indicated they gathered with people not living in their households in the past 30 days in July, compared to 53.1% in March/April 2021.
- Adults who indicated they had a risk factor (asthma, diabetes, or high blood pressure) were just as likely as adults who didn’t have a risk factor to gather with people outside of their households, at 71.5% and 68.8% respectively.
Among adults who gathered with people not living in their households, 38.5% said they always followed state and local guidelines in July and 28.1% said they never or sometimes followed guidelines.
- Adults who said they will not receive the COVID-19 vaccine were more than four times more likely to say they never followed state and local guidelines when gathering with people not living in their household than those who had received at least one dose of the vaccine, 28.1% vs. 6.4% respectively.
Personal and Financial Impacts
Adults who tested positive for COVID-19 were more likely to experience difficulties paying for basic necessities and rent/mortgage, have reduced job hours/income, and lose their jobs than adults who tested negative for COVID-19.
- Adults who tested positive for COVID-19 were nearly twice as likely as adults who tested negative for COVID-19 to have difficulties paying for basic necessities (23% vs. 12.7%, respectively) and difficulties paying rent/mortgage (19.1% vs. 10.7%, respectively).
Personal and financial impacts, such as reduced job hours/income and difficulty paying for basic necessities and rent/mortgage varied by race/ethnicity, citizenship status, and other factors.
- White adults were the least likely to experience reduced job hours/income (14.8%) compared to multiracial (29.8%), Black or African American (28.7%), Latinx (23%), and Asian (18.9%) adults.
- Latinx (17.4%) and Black or African (16.8%) adults were more than twice as likely as white (7%) adults to experience difficulties paying for basic necessities.
- Non-citizens were nearly twice as likely as citizens to have reduced job hours/income, 35% vs. 17.9% respectively, and experience difficulties paying their rent/mortgage, 19.7% vs. 9.7% respectively.
“The data we collected and are continuing to collect are being used to inform policymakers, community leaders, and other advocates so that they are able to effectively reach communities that are most in need,” Ponce said. “This actionable data can assist with outreach efforts to get more people vaccinated or enforce safety protocols to slow down and stop the spread of the disease and get the state on track for a complete recovery. It’s also critical to note that these data can be viewed and used by everyone — whether you’re a data analyst for the state, a grant writer for a nonprofit, a program manager for a community organization, on-the-ground outreach worker, or a concerned Californian.”
by Elaiza Torralba
The UCLA Fielding School of Public Health, founded in 1961, is dedicated to enhancing the public's health by conducting innovative research, training future leaders and health professionals from diverse backgrounds, translating research into policy and practice, and serving our local communities and the communities of the nation and the world. The school has 761 students from 26 nations engaged in carrying out the vision of building healthy futures in greater Los Angeles, California, the nation and the world.
Faculty Referenced by this Article

Dr. Michelle S. Keller is a health services researcher whose research focuses on the use and prescribing of high-risk medications.

Professor of Community Health Sciences & Health Policy and Management, and Associate Dean for Research
Nationally recognized health services researcher and sociomedical scientist with 25+ years' experience in effectiveness and implementation research.
EMPH Academic Program Director with expertise in healthcare marketing, finance, and reproductive health policy, teaching in the EMPH, MPH, MHA program

Dr. Ron Andersen is the Wasserman Professor Emeritus in the UCLA Departments of Health Policy and Management.


